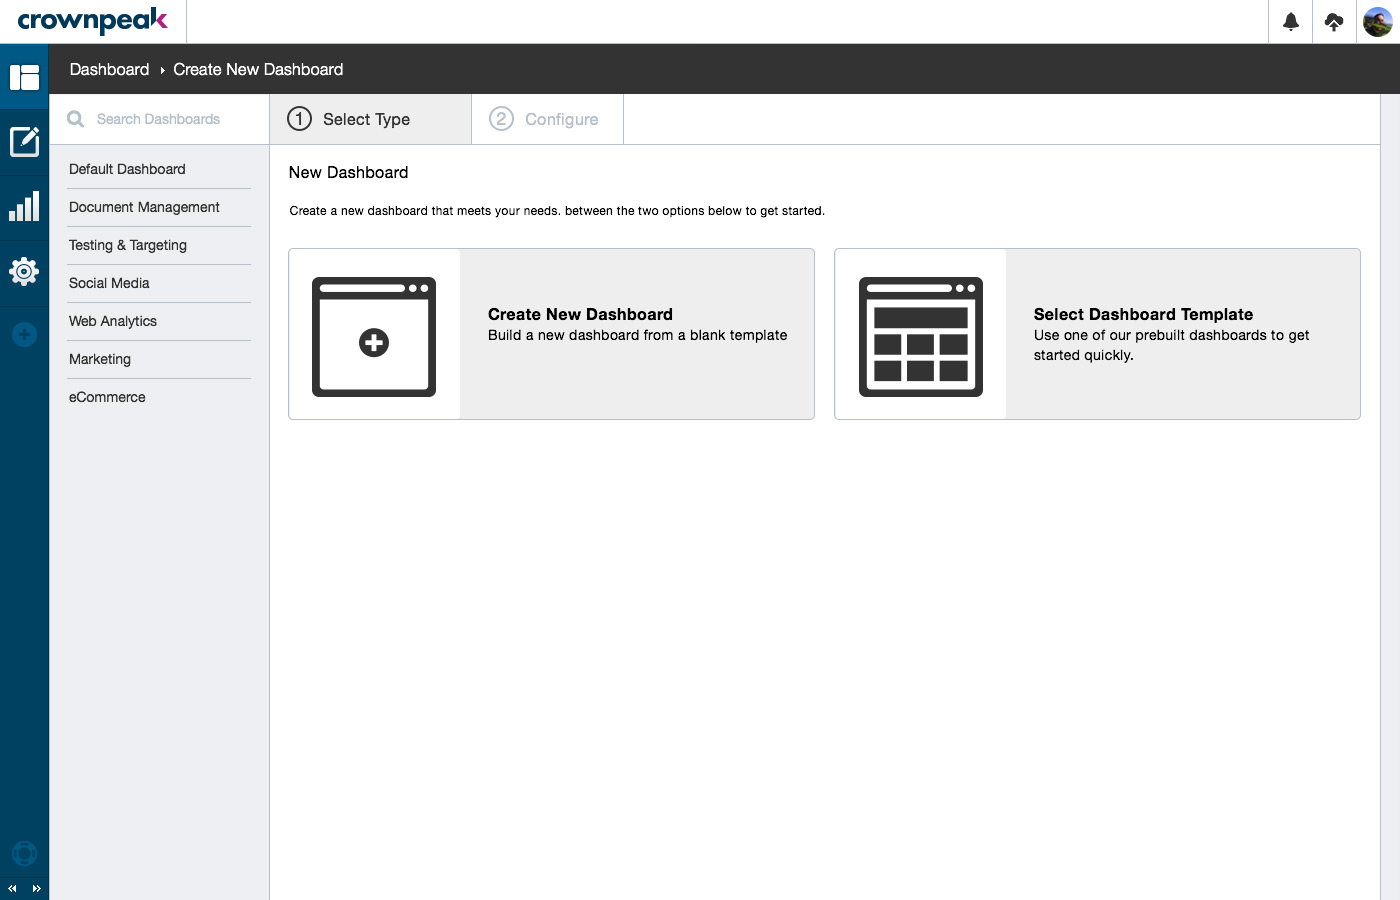
The Dashboard section delivers users a quick glance location to make better decisions and react quickly. A dashboard's purpose is to summarize all the important information under an umbrella. Giving the user a "quick glance" at their data before they dive deeper into the various sections under that umbrella.
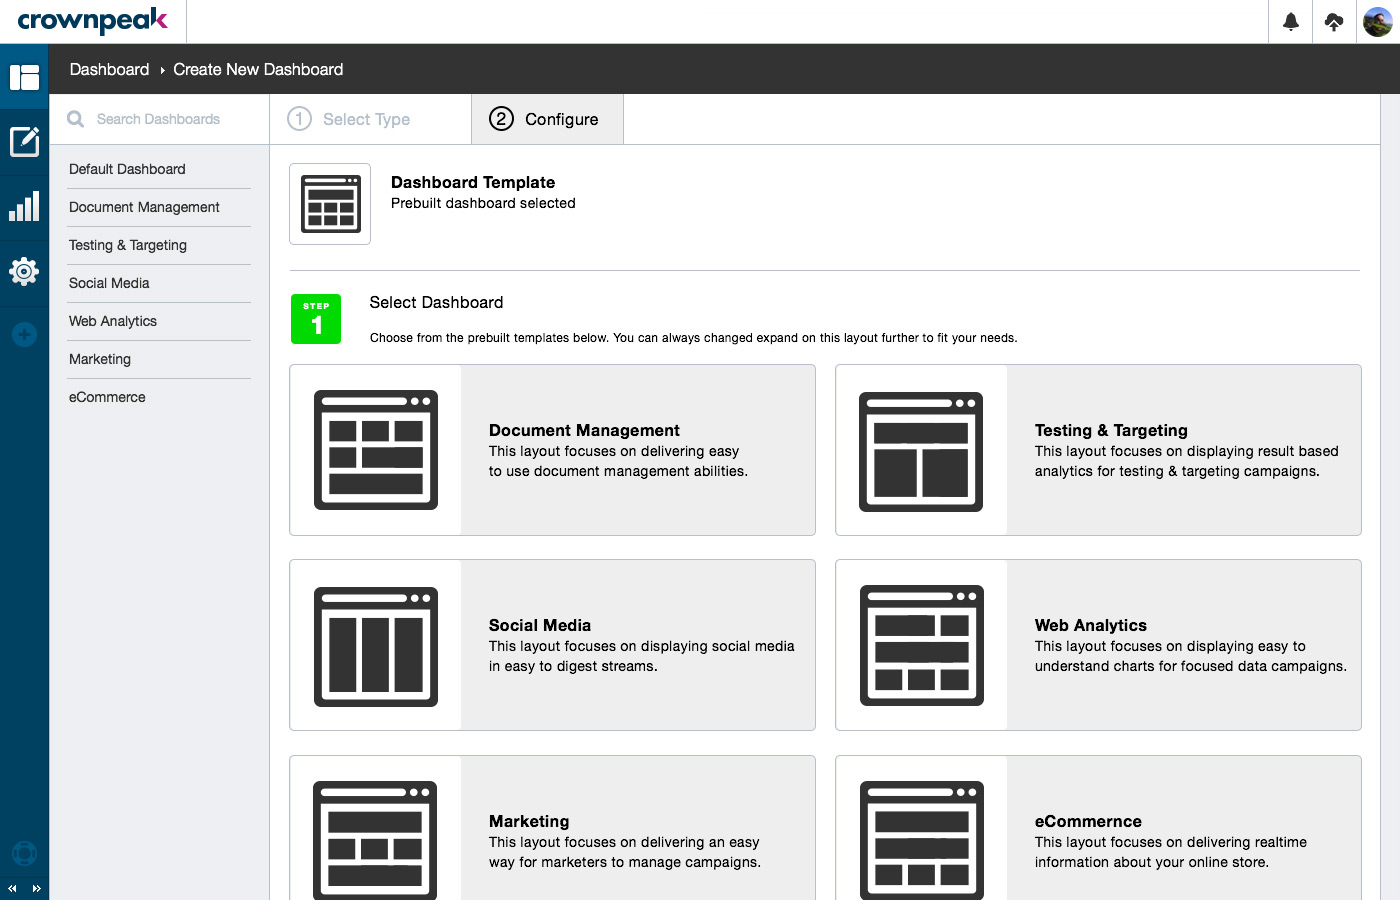
Canvas Default
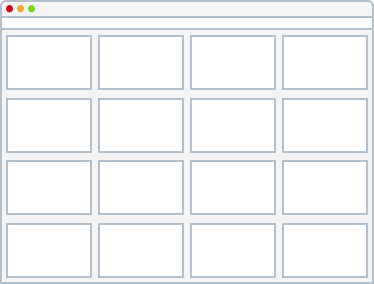
Dashboard Grid
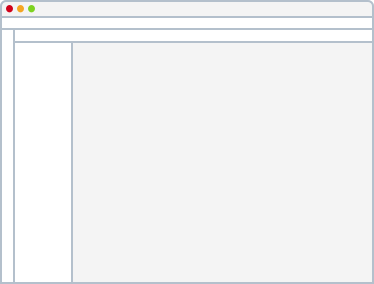
Section Default
Dashboard's should only contain important information. For example:
→ System warnings / alerts / etc.
→ Links to common actions create / browse / manage / etc.
→ Summarized numbers for the day / week / month / etc.
If you have a larger system with a bunch of parts which are always moving (ie. hosting, analytics, project management, etc), dashboards are invaluable. If your users don't use the dashboard you should rethink the information architecture of the page for a more optimized consumption experience. More
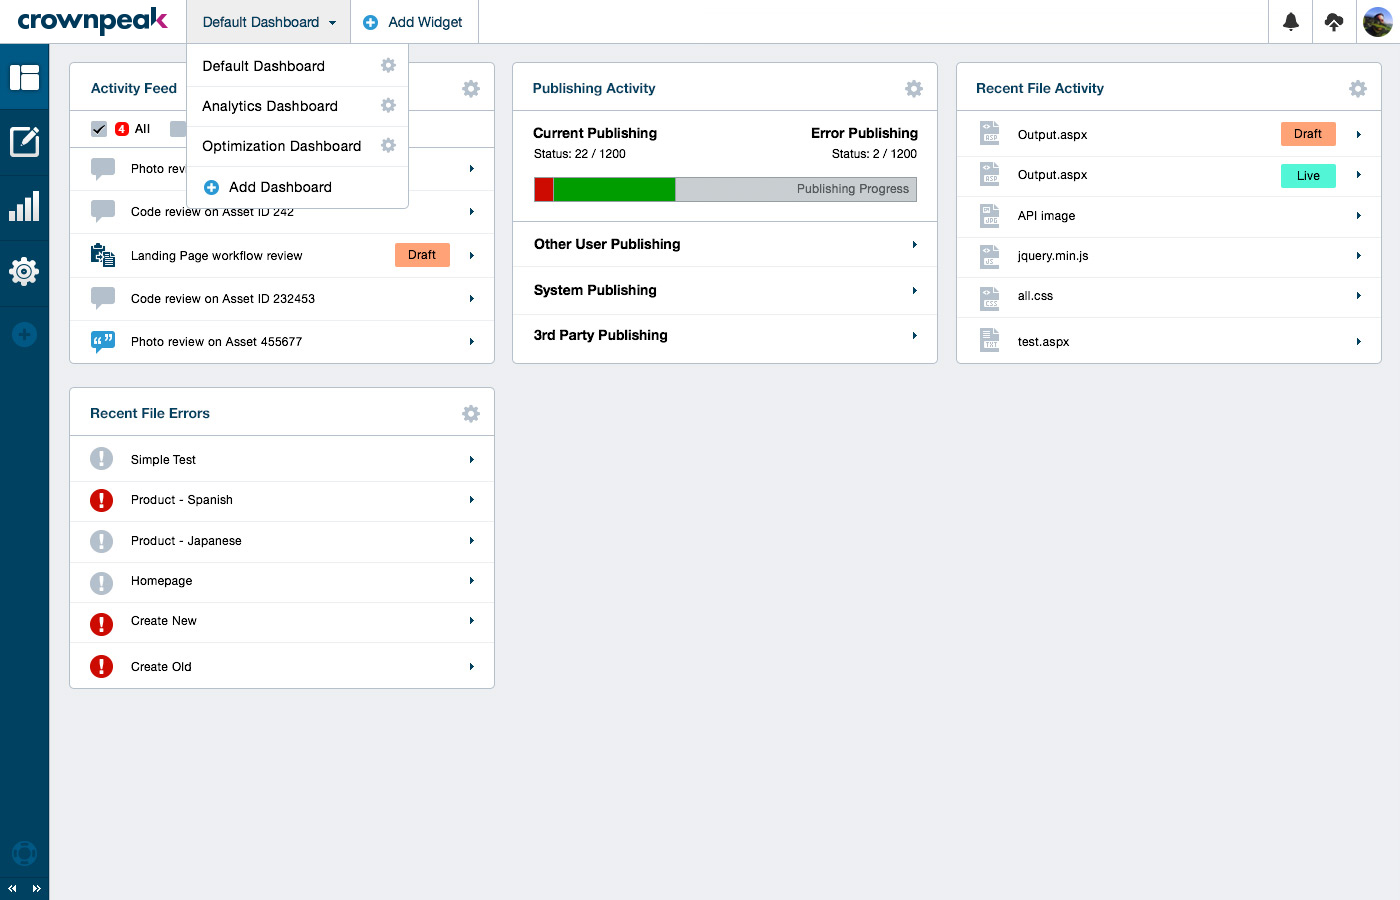
Activity Widget
The activity widget displays the user based activity inside the cms. Users can will be notified of Tasks and Workflow Tasks that have been created inside of this widget.
Publishing Monitor Widget
The publishing monitor widget gives the user a quick glance at the progress and errors that are taking place within the cms. Users can click and navigate to a more indepth view easily.
Recent File Activity Widget
The recent file activity displays the most recent assets that have been updated or adjusted inside of the cms. This is a great way to navigate to items that need to be worked on.
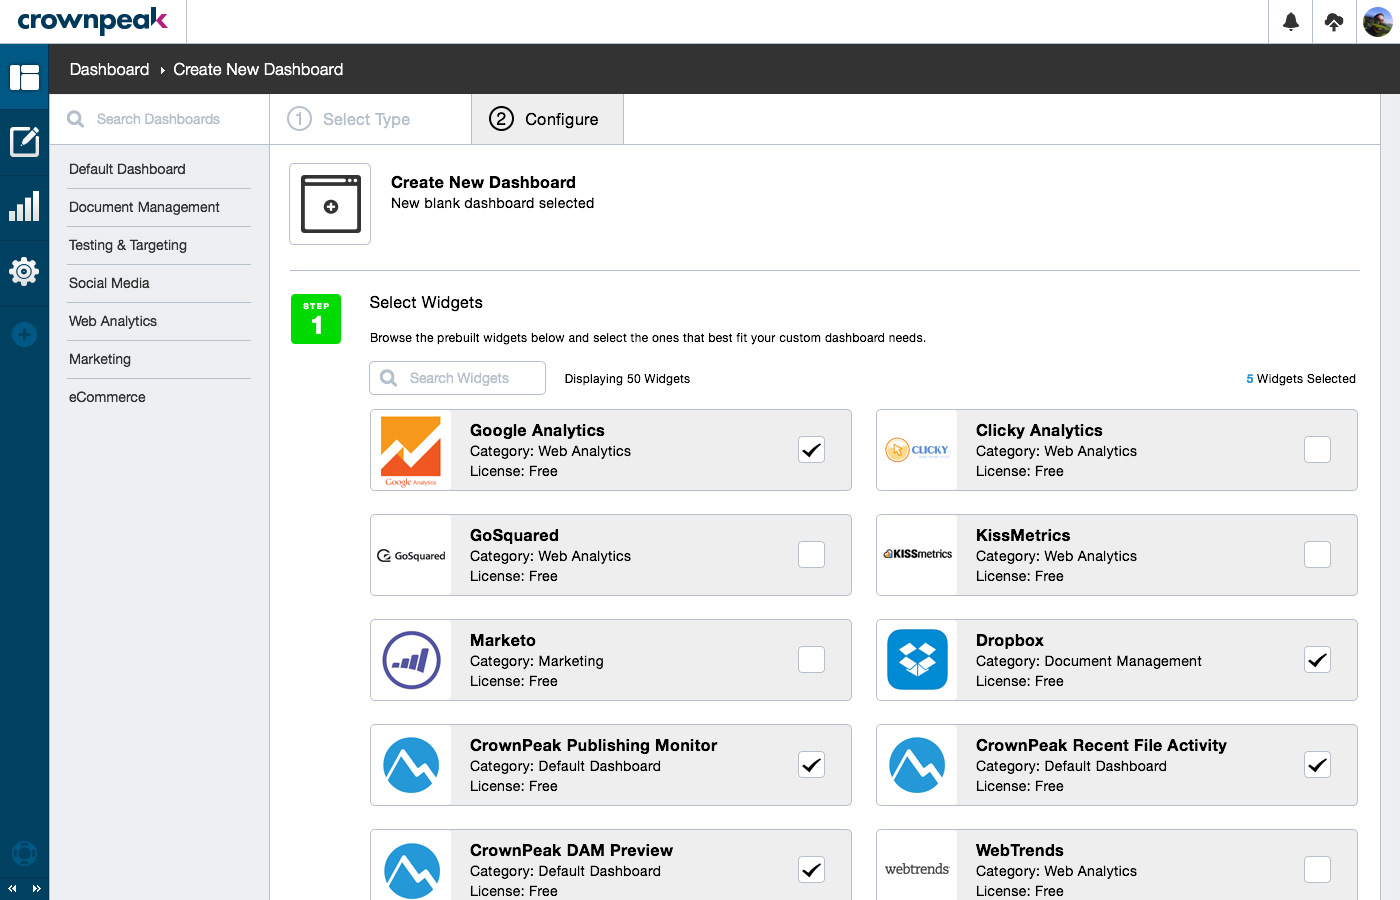
24x7 Widget or Analytics Widget
The 24x7 widget delivers the ability for users to monitor websites, services, or servers. If your business is not interested then we have a general analytics widget that takes it's place.
Errors Widget
The errors widget displays the most recent errors that have taken place inside of the cms. This quick view allows you to navigate directly to the error and fix it.
Help Widget
The help widget is a central location to add help links on the dashboard. This can be adjusted easily to display your business help documents or can be a place where CrownPeak help documents are displayed.
Filter Widget
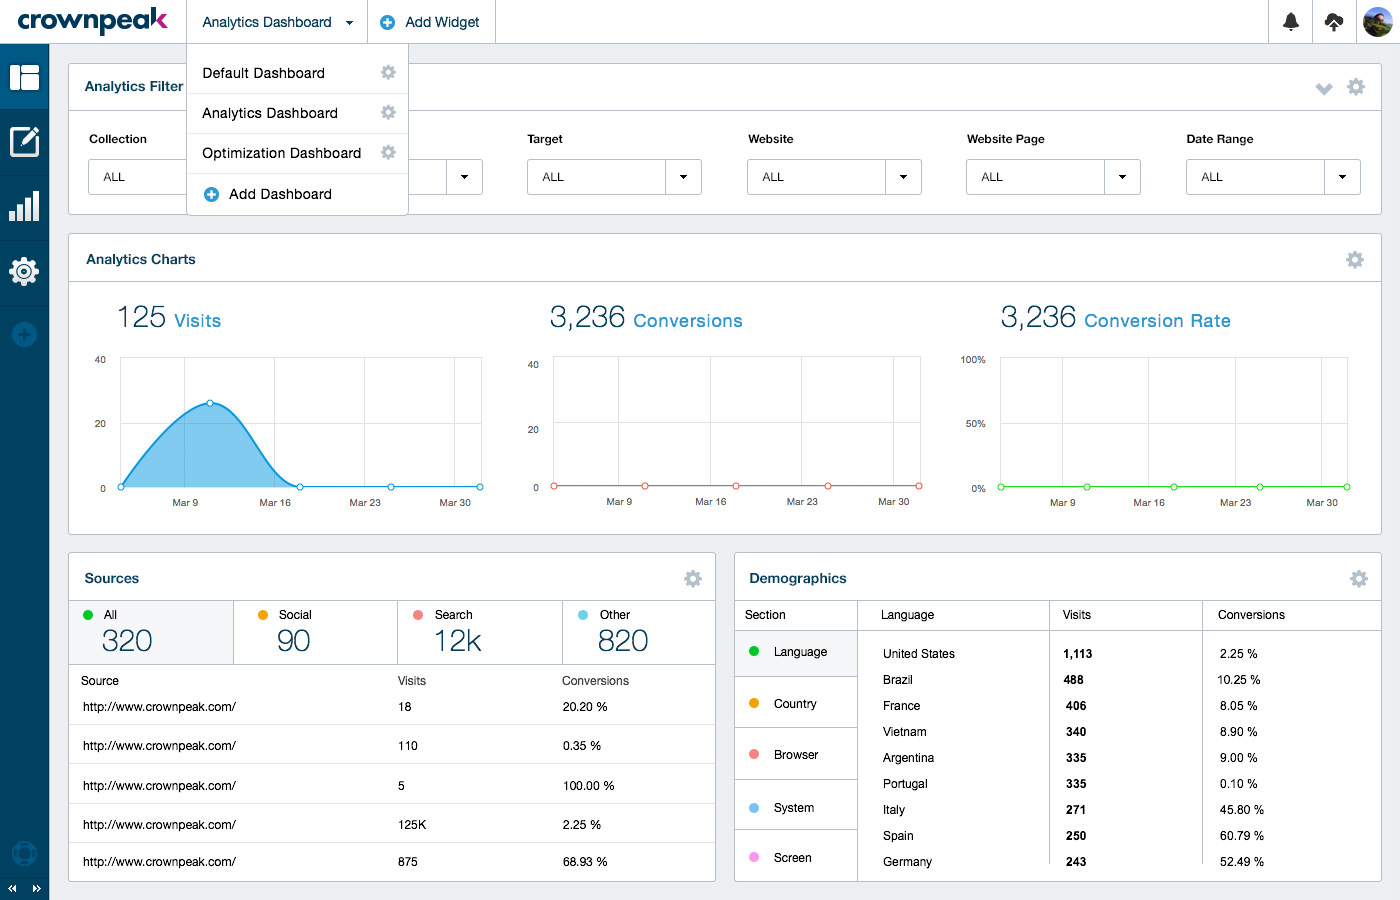
The filter widget can be added to control all other widgets on a dashboard page from a single control. Focused on Optimization this widget can filter for Campaigns, Content Snippets, Profiles, Websites, Web Pages, and Data Ranges.
Mini Optimization Widget
The mini optimization widget gives the user a quick glance at the profile or campaign analytics direct from the active sources. This widget can be used for Website content or Optimization experiences.
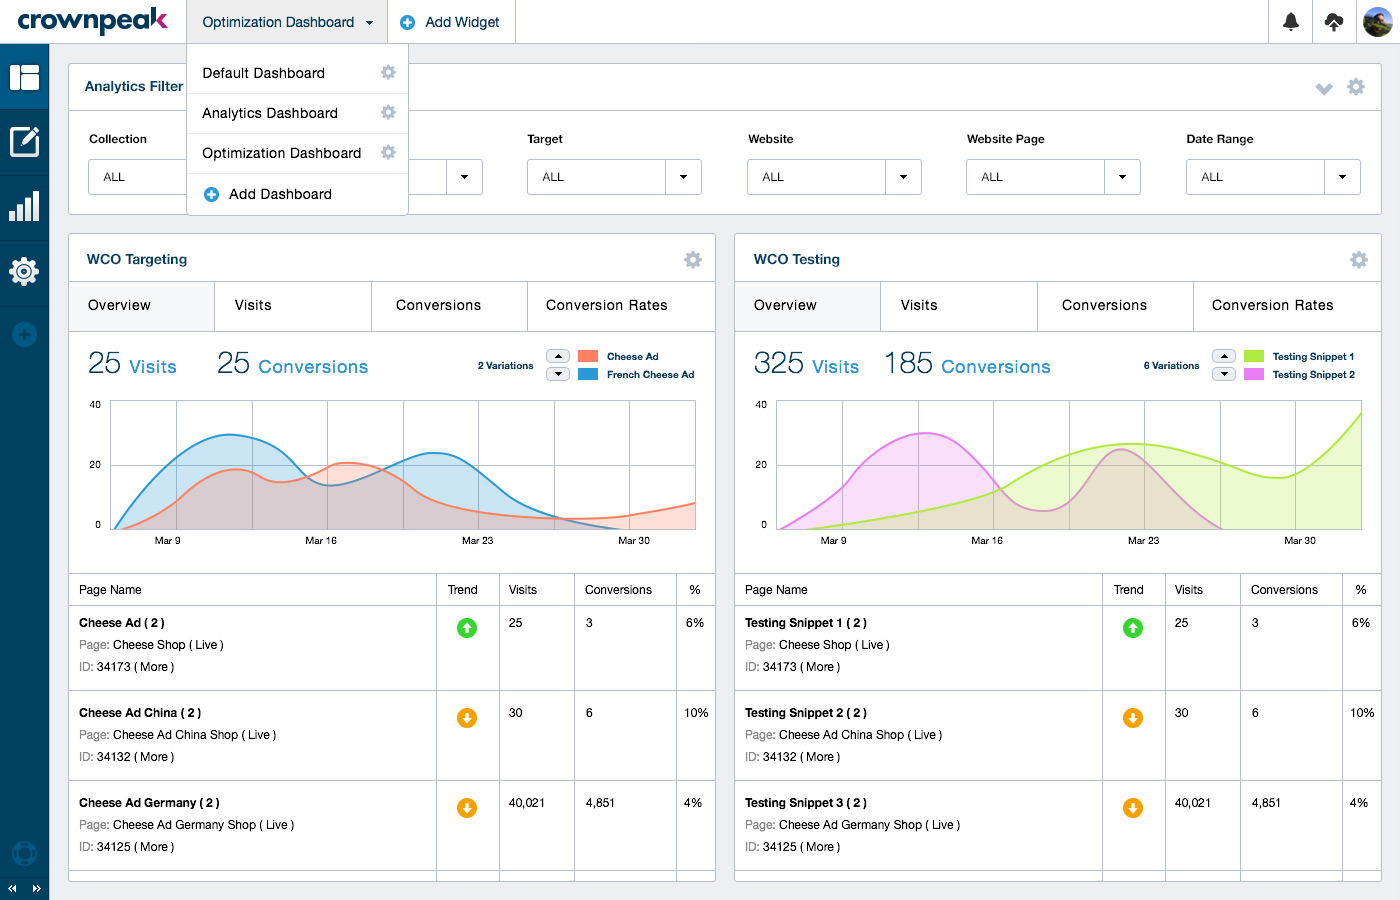
Expanded Optimization Widget
The expanded optimization widget gives the user a more visual interface view of the profile or campaign analytics direct from the active sources. This widget can be used for Website content or Optimization experiences.
Referrals Widget
The referrals widget gives the user a quick glance at analytics such as Social, Search, eMail, and other sources. This widget can be used for Website content or Optimization experiences.
Demographics Widget
The demographics widget gives the user a quick glance at analytics such as Browser, OS, Device, Screen, Language, Country. This widget can be used for Website content or Optimization experiences.
Content Widget
The content widget gives the user a quick glance at analytics such as Sites and Pages. This widget can be used for Website content or Optimization experiences and is setup to allow the user to quickly navigate to the content inside the cms.
Analytics Widget
The analytics widget gives the user a quick glance of analytics by delivering clean visual illustrations for Visits, Conversion, Conv.% over time. This widget can be used for Website content or Optimization experiences.
Mapping Widget
The mapping widget can be configured to be used in many differnt ways. The idea is to present a visual way or showing website visitors or optimization tests and the parts of the world that gain the most interest.
Line graphs are the most widely used graph for showing trends.
Bar graphs are also great at showing trend data.
Pie charts are great at comparing proportions within a single data set.
Similar to pie charts, doughnut charts are great for showing proportional data.

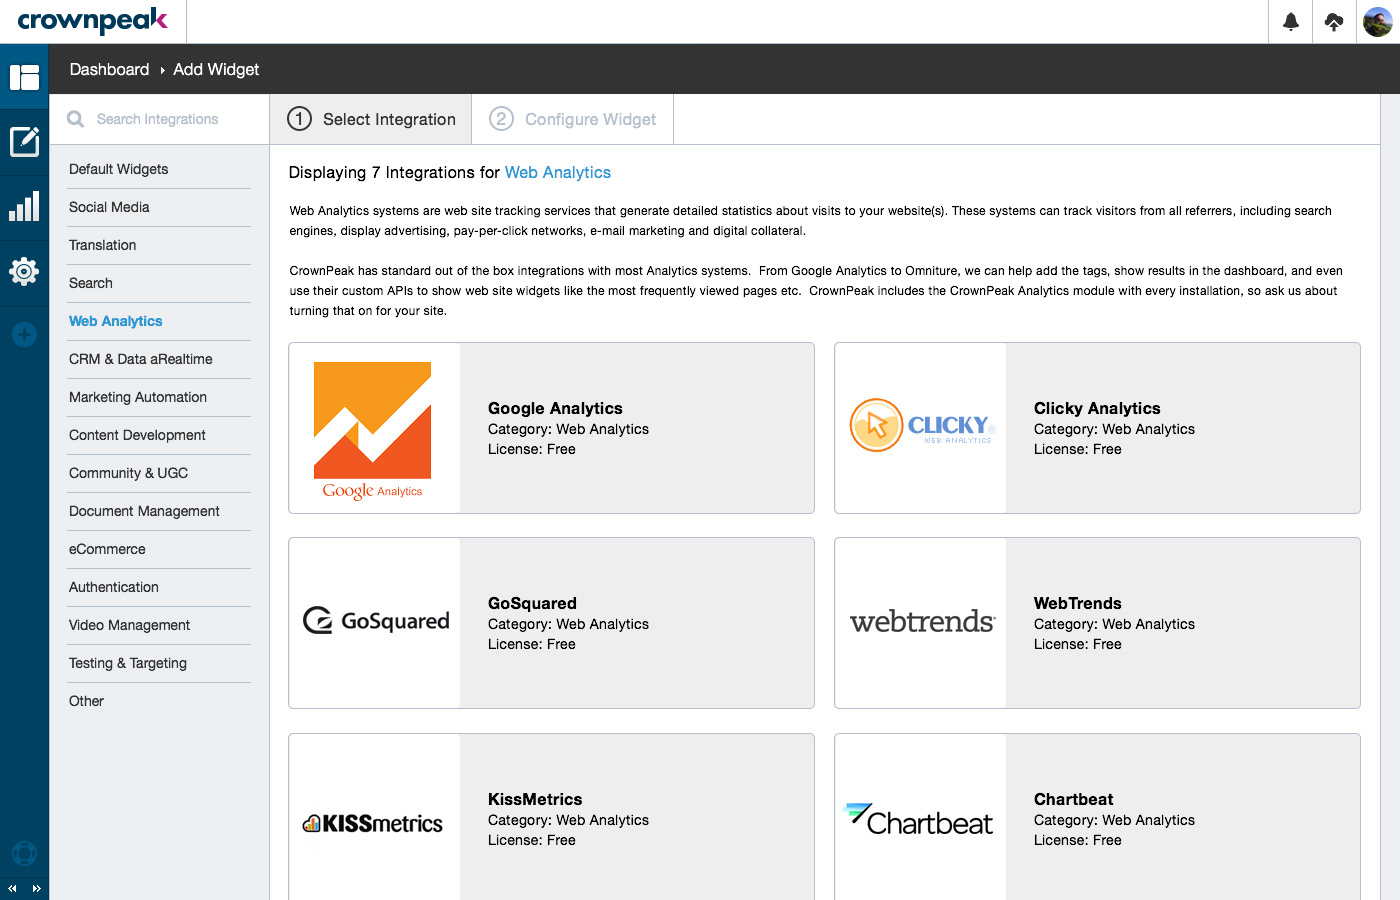
Widget placement relocation.